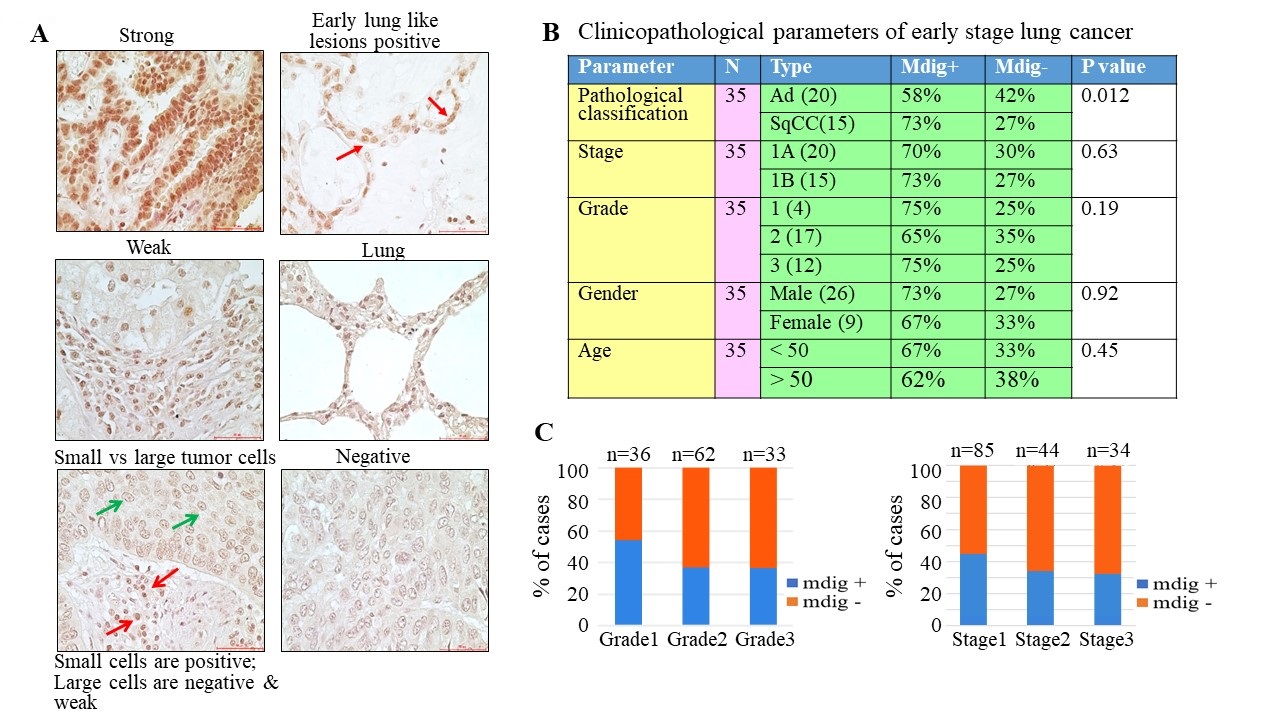
Fig. 3. mdig expression in Early Stage Lung Cancer. (A) Immunohistochemistry of early-stage lung cancer tissue microarray stained for mdig protein. Tissue microarray slide LC820 was used in this analysis. This slide contains 20 cases of Ad, 15 cases of SqCC, and 5 cases of normal lung tissue, with duplicate cores per case. Image showing strong, weak and negative mdig signal in the indicated tissue samples. Bottom left panel: red arrows indicate small tumor cells with strong mdig staining signal and green arrows indicate large tumor cells with negative or weak mdig signal. Top right panel: lesions resembling lung showing alveolar cells that are strongly positive for mdig (red arrows). Magnification 40× and scale bar = 50 μm. (B) Clinicopathological parameters with respect to mdig staining in early-stage lung cancers. (C) mdig expression levels among lung tumors with different grade or stage classification.